Reporting And Dashboards
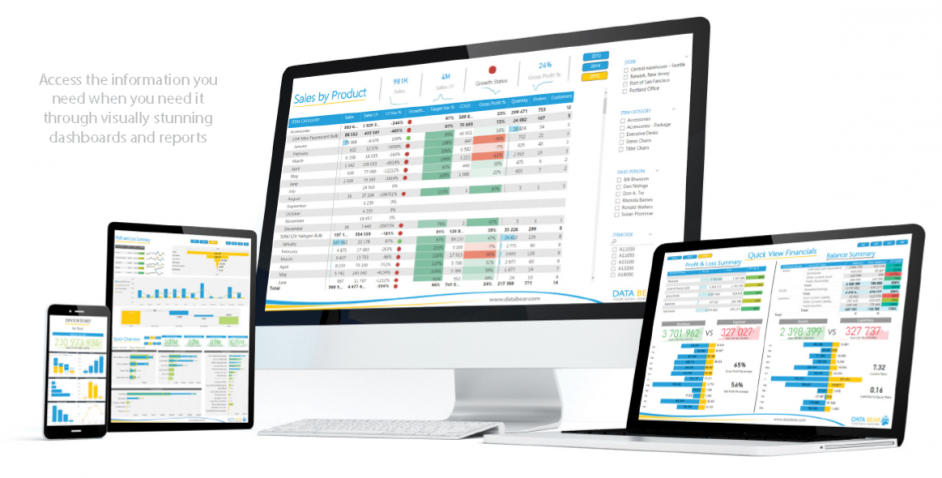
Be empowered to drive effective business change through data driven solutions. Create interactive reports, discover insights and share your findings throughout your organization.In Business Intelligence we have brought you 2 main training’s. Reporting in Excel and Business Intelligence with Power BI. We even teach you which chart to use in which situation.

Reporting and analysis is certainly not a new concept to business, but the difference between how data analysis is done today, compared with five or 10 years ago, is immense. In this course, students will learn some of the more advanced features of Excel specifically for reporting purposes, you will learn how to analyse and manipulate data, work with multiple worksheets, advanced formula construction, present data, learn how to create stunning, world-class Excel dashboards, and create brilliant Power Pivot dashboards.

- Power BI is an amazing cloud-based business analytics service provided by Microsoft that allows users to transform data into rich, interactive visual reports that present a 360-degree business view and improve business decision making. It allows you to connect to a huge range of data sources, clean and transform messy data, create relationships between data sets, perform calculations and prepare stunning interactive reports.
Who should Attend?
- Excel users & analysts that focus on extracting, re-organizing and analyzing data
- Anyone involved in creating visualizations &data modelling
- Anyone interested in saving huge amounts of time in automating the work involved in creating recurring reports and dashboards
We’ll show you how, without needing former data analysis training or needing to learn another language, you can be building and sharing the reports and dashboards of your dreams.

